Marine Terminals at Los Angeles and Long Beach Ports to Power Docked Ships with Electricity by Year-End

LONG BEACH, Calif., May 21, 2013 – PierPass Inc. today announced that all 13 international cargo terminals at the Port of Los Angeles and Port of Long Beach will be ready to deliver shore power to ships at berth by the end of this year, an investment that will significantly reduce air pollution in and around the ports.

The infrastructure to supply shore power – also known as cold ironing or Alternative Marine Power (AMP) – is being installed in support of clean air initiatives led by the two ports and the California Air Resources Board (ARB). ARB has mandated that by Jan. 1, 2014, half of all visits by container cargo, refrigerated cargo and cruise vessels must be powered by electricity. The rule applies to fleets making at least 25 visits per year to California ports.

Currently, most ships power themselves while at berth by continuously running on-board auxiliary diesel engines, during visits that typically last about 24 hours. Ships are the single largest source of port-related pollutants including particulate matter, oxides of sulfur and oxides of nitrogen. Shore power cuts air pollution from a ship at berth by 95 percent, according to the Port of Long Beach.

“Terminal operators are working hard to help the ports and ARB implement this important clean air measure,” said Bruce Wargo, president of PierPass. “As part of the ongoing innovations and investments that have made the Ports of Los Angeles and Long Beach the cleanest and most efficient in the country, the shore power initiative will deliver significant air quality benefits to port workers and nearby communities.”

Nearly half the terminals in the ports are already offering shore power in at least some of their berths. These include WBCT, TraPac, YTI and STS at the Port of Los Angeles, and Pier C60 (SSA) and ITS at the Port of Long Beach.

Working with the ports and ARB to enable shore power is only the latest measure taken by the marine terminal operators (MTOs) to improve air quality around the ports. PierPass and its member terminal operators continue to offer night gate operations that move truck traffic out of peak daytime hours, reducing traffic congestion and improving air quality. Terminals are currently offering 55 OffPeak gates across 13 terminals, in addition to 65 daytime gates, for a total of 120 gates per week for cargo pickup and delivery.
 

Download Release

PierPass May News and Updates

PierPass Monthly Transaction Data

As part of our monthly newsletters we provide a summary of the latest transaction data from marine terminal operators (MTOs) at the Port of Los Angeles and Port of Long Beach. Below please find data from the month of April 2013.

Truck activity information is derived from RFID data.

Average in-terminal turn time:

  • 37.4 minutes day shift
  • 39.9 minutes night shift
    (Excluding lunch hour, breaks and trouble tickets)

In-terminal turn time is the average amount of time a truck is inside a terminal to complete a transaction. Turn time at individual terminals will vary depending on time of day and other factors.  The average in-terminal turn time in March 2013 was 37.4 minutes for the day shift and 37.9 minutes for the night shift.

Frequent callers* average moves per day:

  • 10% trucks 5 or moves per day
  • 16% trucks 4 moves per day
  • 30% trucks 3 moves per day
  • 27% trucks 2 moves per day
  • 17% trucks 1 move per day

*The ports define frequent callers as trucks making one or more moves per weekday. Average moves per day by frequent callers tells us how many moves a truck can make if it is working every day. In April 2013, 26 percent of frequent callers made four or more moves per day.

Day vs. Night Gates:

  • Average daily number of day gate moves: 14,388
  • Average daily number of night gate moves: 15,366
  • Number of day shifts open: 25
  • Number of night shifts open: 17

The number of unique trucks calling on both ports in April was 10,806. Approximately 8,500 trucks regularly service the POLA/POLB.

Note:

  • Terminals were closed one day shift for Cesar Chavez’ Birthday and one night shift for a Stop Work meeting.

Please continue to check our web site for our Trouble Ticket Reports and tips on how to reduce trouble ticket problems.

Trouble Ticket Report #5 – WBCT

As part of our continuing effort to better understand trouble tickets and their causes West Basin Container Terminal (WBCT) in the Port of Los Angeles has provided the fifth in our series of reports.

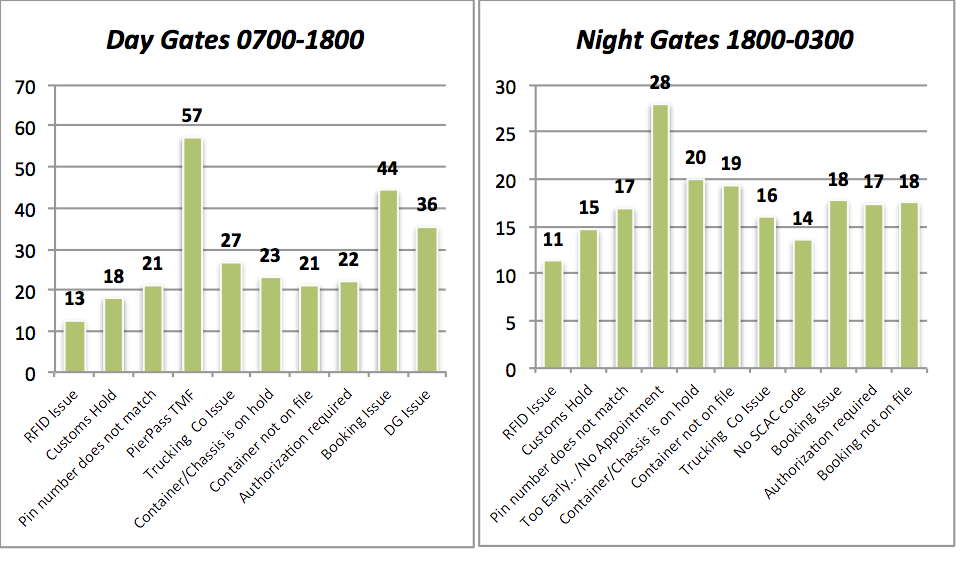
WBCT’s report is the first in our series to break out average delays caused by individual types of trouble tickets. During the day gates, the longest delays – an average of 57 minutes in January and February – are caused by dispatching drivers to move a container before the Traffic Mitigation Fee has been paid. During the night gates, arriving too early before the appointment time or the start of the night gates is the longest cause of delays, at an average of 27 minutes.

At WBCT, the largest generator of trouble tickets is truck registration information in their database. Interestingly, it is also the easiest and least time-consuming (11 minutes on average) to fix.

Like previous reports, many of the issues that generate a trouble ticket and additional truck delays can be avoided with some advance checking in the terminal computer system for import availability, booking number accuracy and TMF payment status.

In this month’s example (please see below), Jeff Boden details WBCT’s experience with trouble tickets for January and February of 2013 and provides tips on how to avoid them.

Bruce Wargo
President & CEO
PierPass, Inc.

WBCT Trouble Transaction Observations

In an effort to improve our customers’ experience while on terminal we have been tracking the number and type of trouble transactions and the length of time needed to correct them. Through our observations we have noticed that the trucking community is preparing their drivers for the terminal more and more, but there is still room for improvement.

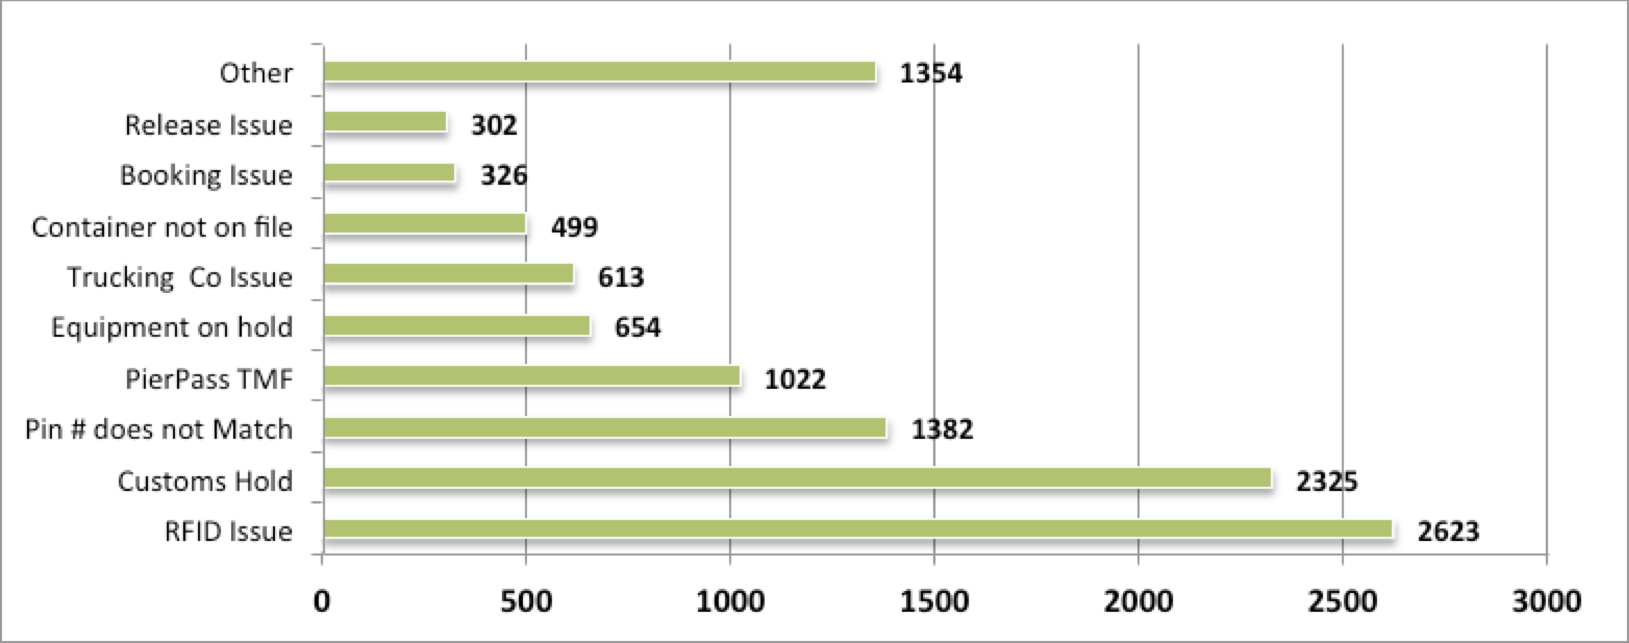
Your efforts to reduce the frequency of these problems have been noticed. During the last two months at WBCT, we have completed 133,305 gate moves, with only 5,932 going to the trouble window, or generating trouble tickets. That means only 4.45% of the drivers at our terminal had a trouble transaction to correct.

Frequency of Trouble Transactions by Cause

As you will see from our data below, the largest single cause of top trouble tickets issued at WBCT is trucks arriving with incorrectly registered RFID tags. Most of these troubles are from the truck not being registered for the company that the driver is reporting he is driving for. You can also see that this is the quickest trouble for us to resolve at only 11 minutes on average. This issue can be avoided entirely by ensuring that your drivers are correctly registered to your company with eModal before they enter the terminal.

Another major contributor at the trouble window is the customs hold. It is our procedure to have drivers come to the window with their paperwork to clear customs holds. While the number of trouble transactions due to this cannot be changed, the time spent at the window can certainly be reduced by checking your containers on our website www.voyagertrack.com ahead of time for these types of holds and sending your driver in with all necessary paperwork or fees due.

We also see heavy volume at the trouble window with drivers that do not have the correct Pin number for their transaction. This takes drivers an extra 17-21 minutes to get their container on average and accounts for as much as 16% of all trouble transactions. By making sure that drivers have the correct information, this number can be greatly reduced.

Breakdown of Trouble Transactions over January and February

Breakdown of Trouble Transactions over January and February

Time Lost

Two unnecessary trouble tickets that have caused long wait times can be easily corrected.  The first is arriving too early for the scheduled pick-up appointment time.  Drivers should arrive at the terminal no earlier than one hour from their scheduled pick-up appointment time.  This will allow them to complete any return moves and stage for the pick-up.  Drivers arriving prior to one hour before their appointment   will have to wait causing undue stand-by time.  WBCT will process drivers in for PierPass pick-ups at 1700, and 1800 for Export PierPass returns.  Drivers arriving prior to that time will be forced to wait outside the gates until those times. Please dispatch your drivers accordingly, as over the last two months we have seen average wait times at 28 minutes for imports and 57 minutes for exports due to the above mentioned troubles.

The second most time-consuming trouble ticket is issued to drivers with booking issues or trucking company issues.  The booking issue could be anything from a full booking to the wrong size or type of container on a booking.  The trucking company issues are most commonly that the trucking company is not registered with the steamship line or the trucking company has been put on hold by the steamship line.  These issues can be avoided by regularly checking your booking, correctly dispatching drivers and making sure your company is currently registered and clear of any steamship line holds.  Please confirm both of these items prior to dispatching drivers to the terminal.

Equipment holds are the third most time-consuming trouble ticket issued to drivers.  Drivers arriving to pick up containers or chassis that are on hold will receive these unnecessary trouble tickets.  Information pertaining to container and chassis availability is available on our website www.voyagertrack.com.  The information provided is current and drivers should never be dispatched to pick up a container or chassis that is showing on hold without consent from the terminal.

Average Delays (in minutes) by Type of Trouble Transaction in January and February

Average Delays (in minutes) by Type of Trouble Transaction in January and February

Conclusion

By following our above recommendations, we believe that trouble tickets and wait times can be reduced by at least 30%.  We also recommend familiarizing yourselves with Voyager Track Website (www.voyagertrack.com), which offers several tools our customers can utilize including appointment setting, container availability and payment options.  We also encourage you to reach out to our customer service staff for assistance resolving or avoiding these issues if you can’t resolve the issue online.  The customer service group can be reached via email at wbctcs@wbct.us and wbcttow@wbct.us.

PierPass April News and Updates

PierPass Monthly Transaction Data
As part of our monthly newsletters we provide a summary of the latest transaction data from marine terminal operators (MTOs) at the Port of Los Angeles and Port of Long Beach. Below please find data from the month of March 2013.

Truck activity information is derived from RFID data.

Average in-terminal turn time:

  • 37.4 minutes day shift
  • 37.9 minutes night shift

(Excluding lunch hour, breaks and trouble tickets)

In-terminal turn time is the average amount of time a truck is inside a terminal to complete a transaction. Turn time at individual terminals will vary depending on time of day and other factors. The average in-terminal turn time in January 2013 was 41.1 minutes for the day shift and 43.2 minutes for the night shift.

Frequent callers* average moves per day:

  • 6% trucks 5 or moves per day
  • 12% trucks 4 moves per day
  • 29% trucks 3 moves per day
  • 34% trucks 2 moves per day
  • 19% trucks 1 move per day

*The ports define frequent callers as trucks making one or more moves per weekday. Average moves per day by frequent callers tells us how many moves a truck can make if it is working every day. In February 2013, 32 percent of frequent callers made four or more moves per day.

Day vs. Night Gates:

  • Average number of day gate moves: 11,668
  • Average number of night gate moves: 11,949
  • Number of day shifts open: 27
  • Number of night shifts open: 17

The number of unique trucks calling on both ports in March was 10,390. Approximately 8,500 trucks regularly service the POLA/POLB.

Note:
Terminals were closed one night shift for a Stop Work meeting.

Please continue to check our website www.pierpass.org for our Trouble Ticket Reports and tips on how to reduce trouble ticket problems.

PierPass March News and Updates

PierPass Monthly Transaction Data
As part of our monthly newsletters we provide a summary of the latest transaction data from marine terminal operators (MTOs) at the Port of Los Angeles and Port of Long Beach. Below please find data from the month of February 2013.

Truck activity information is derived from RFID data.

Average in-terminal turn time:

  • 41.1 minutes day shift
  • 43.2 minutes night shift

(Excluding lunch hour, breaks and trouble tickets)

In-terminal turn time is the average amount of time a truck is inside a terminal to complete a transaction. Turn time at individual terminals will vary depending on time of day and other factors. The average in-terminal turn time in January 2013 was 37.5 minutes for the day shift and 40.6 minutes for the night shift.

Frequent callers* average moves per day:

  • 12% trucks 5 or moves per day
  • 20% trucks 4 moves per day
  • 30% trucks 3 moves per day
  • 23% trucks 2 moves per day
  • 15% trucks 1 move per day

*The ports define frequent callers as trucks making one or more moves per weekday. Average moves per day by frequent callers tells us how many moves a truck can make if it is working every day. In February 2013, 32 percent of frequent callers made four or more moves per day.

Day vs. Night Gates:

  • Average number of day gate moves: 13,737
  • Average number of night gate moves: 13,355
  • Number of day shifts open: 23
  • Number of night shifts open: 16

Approximately 8,500 trucks regularly service the POLA/POLB.

Note:
Terminals were closed for two holidays (Lincoln’s Birthday and President’s Day), and were closed an additional night shift for a Stop Work meeting.

Please continue to check our web site www.pierpass.org for our Trouble Ticket Reports and tips on how to reduce trouble ticket problems.

Trouble Ticket Report #4 – YTI

As part of our initiative to reduce the number of transaction problems experienced when trucks pick up or deliver containers at the marine terminals at the Ports of Los Angeles and Long Beach, PierPass has been surveying terminal operators to determine the most common causes of trouble tickets.

In this month’s example, Bill Peratt and Doug Hansen from Yusen Terminal Inc. (YTI) present their terminal’s experience for the months of November and December of 2012 and January of 2013. As with other terminals, a large percentage of trouble tickets could be avoided by checking the terminal’s web site or phone system before sending a driver to the terminal.

Although most trouble tickets can be avoided, it is important to understand that some containers such as hazardous, over dimensional and reefer containers will be issued a trouble ticket in order to have terminal staff review important paperwork, confirm reefer settings and confirm dimensions for terminal and vessel operations.

Bruce Wargo
President & CEO
PierPass, Inc.

YTI INC. LOS ANGELES TROUBLE TICKET ANALYSIS

Over the past three months as many as 8.25% of truckers attempting to enter YTI have been issued Drivers Assistance or “Trouble” tickets. The most common causes of trouble tickets included unavailability of import containers and booking number issues for export containers. Trouble tickets for both situations can be avoided by checking the terminal’s online container and booking number availability programs before sending a truck.

Another significant cause was import containers located in areas of the container yard that are closed due to vessel loading or unloading. As these partial yard closures are very dynamic, YTI suggests dispatchers check the YTI website shortly before sending a truck.

Trouble Ticket Analysis

The last three months show the following totals for trucker activity:

Month Total Passes Issued Total Trouble Tickets Percentage
Nov 2012 40,919 2,925 7.1%
Dec 2012 40,161 3,315 8.25%
Jan 2013 48,285 3,304 6.84%

.
The top 8 categories for the past three months are listed below:

Trouble Ticket Category November 2012 December 2012 January 2013
Booking error/number/equipment/TMF Hold 866 861 728
Closed Area of Yard 690 880 951
Line Empty not Allowed 499 363 195
Bad Container Number 158 217 229
Container on Customs/Freight/Terminal Hold 141 221 259
Trucker Not Authorized for Line 96 92 100
Container has Already Been Delivered 96 92 100
Free Time Has Expired 19 72 75
Total for Month 2205 2760 2611

.
Percentages for the top 8 categories in each month are presented:
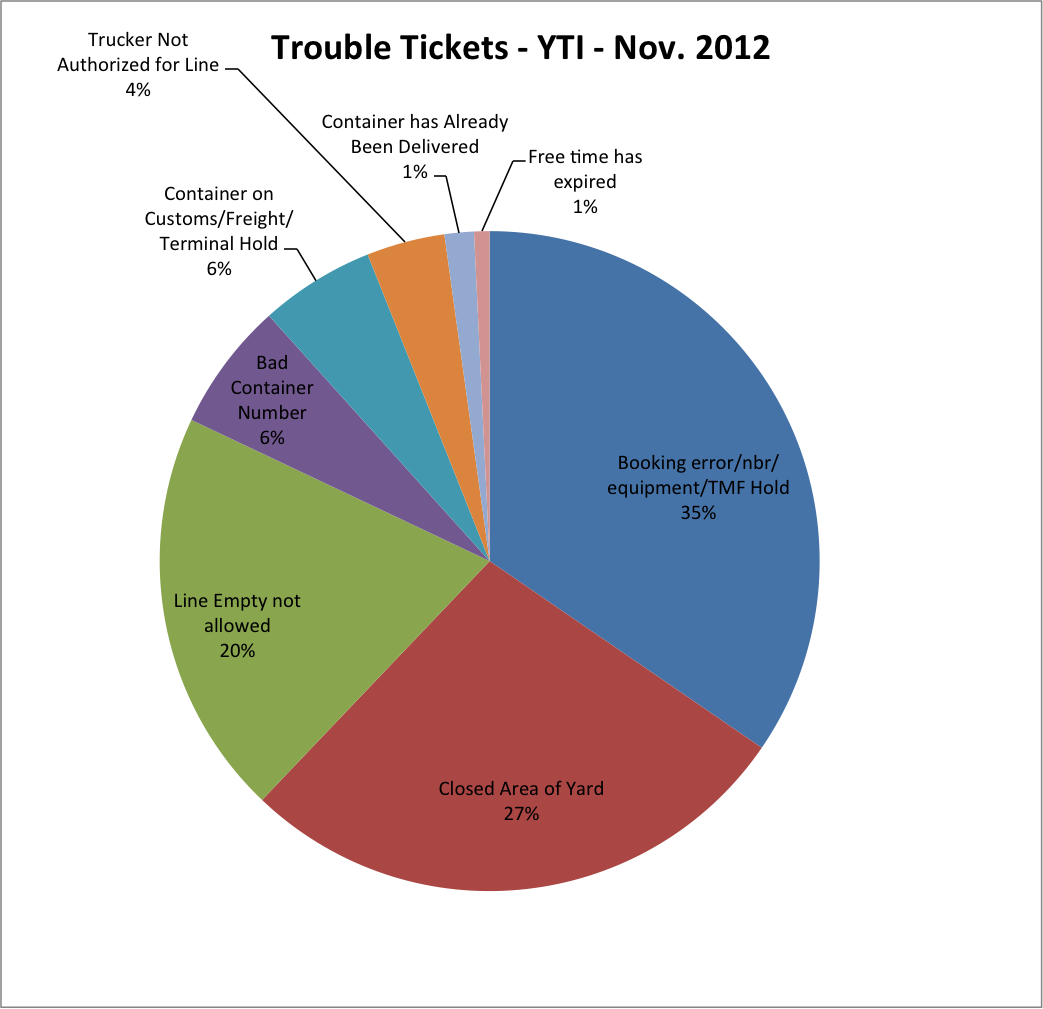
PP Pie Chart

The best way for truckers to turn around quickly is to avoid trouble tickets.  Here is how you and your dispatchers can avoid these costly delays and help improve the overall experience when picking up or delivering a container to YTI.

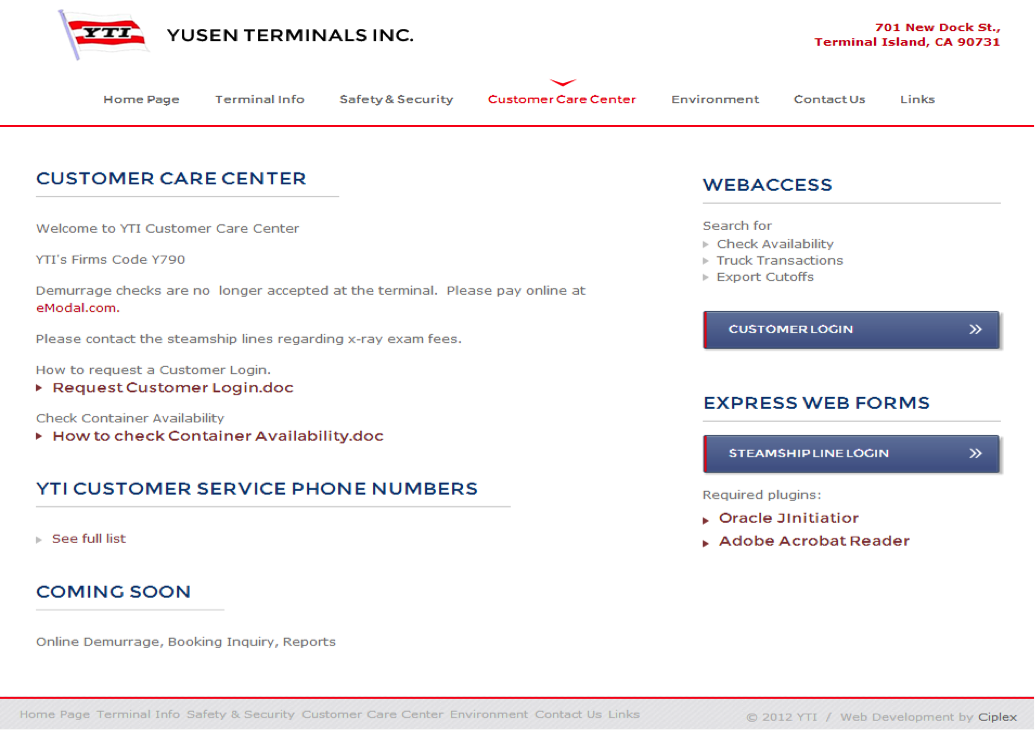
YTI and its Steamship Line partners have made available several online resources for the trucking community. The YTI website, www.yti.com has complete information on import container availability and hold status. Steamship Line sites present all necessary booking information.
PP Yusen

For a live view of the in and out gates as well as the chassis yard at YTI, please also visit our website, www.yti.com to find “Terminal Cameras” on the bottom right hand side of our home page.  This view will allow you to see what a driver can expect on arrival. Please note that the gates are generally underutilized in the first half of the day.
PP NYK

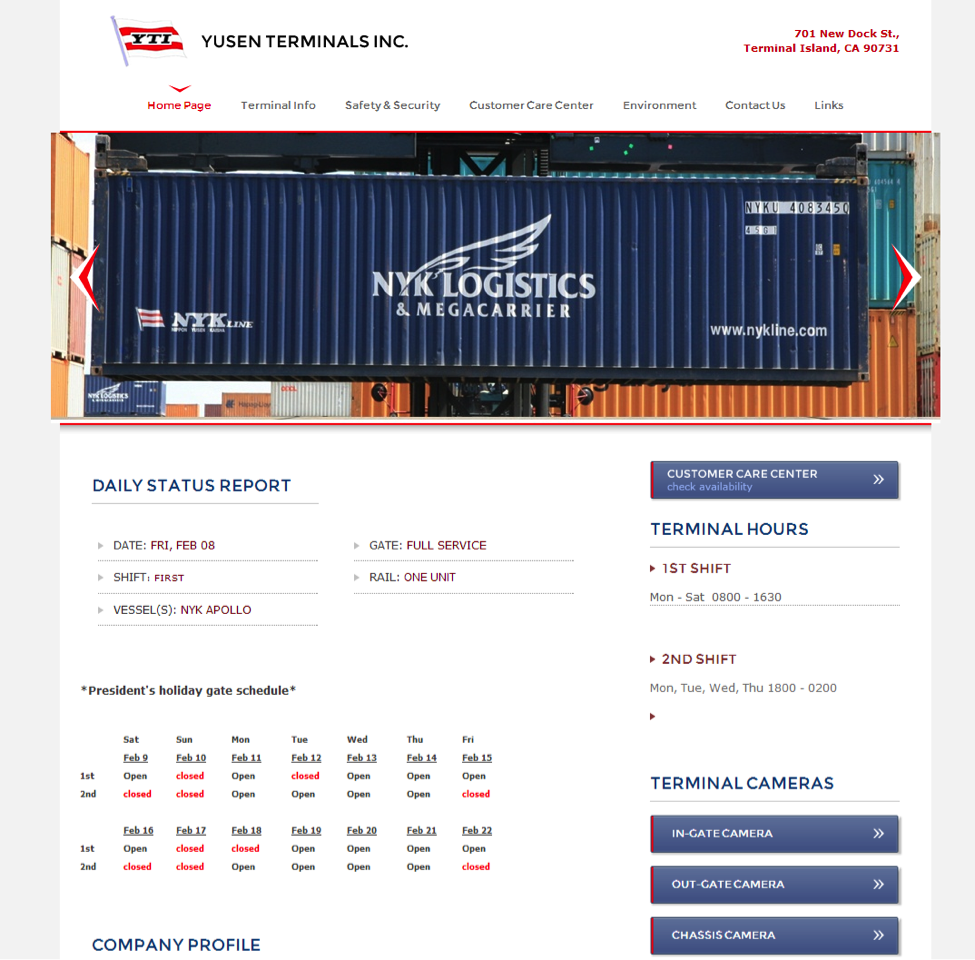
To be sure that you and your dispatchers have the most up to date scheduling information about YTI’s gates and yard areas, please refer to the YTI website homepage or the eModal website at www.emodal.com.

PierPass February News and Updates

PierPass Monthly Transaction Data
As part of our monthly newsletters we provide a summary of the latest transaction data from marine terminal operators (MTOs) at the Port of Los Angeles and Port of Long Beach. Below please find data from the month of January 2013.

Truck activity information is derived from RFID data.

Average in-terminal turn time:

  • 37.5 minutes day shift
  • 40.6 minutes night shift

(Excluding lunch hour, breaks and trouble tickets)

In-terminal turn time is the average amount of time a truck is inside a terminal to complete a transaction. Turn time at individual terminals will vary depending on time of day and other factors.

Frequent callers* average moves per day:

  • 13% trucks 5 or moves per day
  • 19% trucks 4 moves per day
  • 27% trucks 3 moves per day
  • 22% trucks 2 moves per day
  • 19% trucks 1 move per day

*The ports define frequent callers as trucks making one or more moves per weekday. Average moves per day by frequent callers tells us how many moves a truck can make if it is working every day. In January 2013, 32 percent of frequent callers made four or more moves per day.

Day vs. Night Gates:

  • Average number of day gate moves: 16,437
  • Average number of night gate moves: 17,047
  • Number of day shifts open: 25
  • Number of night shifts open: 17

Approximately 8,500 trucks regularly service the POLA/POLB.

Note:
Closed one night for Stop Work meeting, New Years Day and the MLK Holiday.

Please continue to check our web site www.pierpass.org for our Trouble Ticket Reports and tips on how to reduce trouble ticket problems.

Pre- Dispatch / Departure Checklist and Terminal Contacts

PierPass continues to survey terminal operators at the Long Beach and Los Angeles ports to determine the most common causes of trouble tickets. Initial finding show that trouble tickets, while  caused by a range of issues, usually are tied to inaccurate or incomplete information about an import container delivery or an export booking problem. When issued a trouble ticket, the driver typically has to go to a “trouble window” or office to get the issue resolved. This results in delays for customers and truckers and higher costs for terminal operators. Below is a checklist and resources to assist the trucking community in finding the correct information about container deliveries and export bookings.

Click to Download

[slideshare id=16411454&doc=trouble-ticket-checklist-130207175847-phpapp02&type=d]

Marine Terminal Operators at the Ports of Los Angeles and Long Beach Launch Initiative to Speed Cargo Moves by Reducing Trouble Tickets

[youtube=http://www.youtube.com/watch?v=aqxtJGeKNb4&feature=youtu.be]
LONG BEACH, Calif., Jan. 10, 2013 – PierPass Inc. today announced an initiative to reduce the number of transaction problems experienced when trucks pick up or deliver containers at the marine terminals at the Ports of Los Angeles and Long Beach. These problems – exceptions from normal processes that result in the issuance of “trouble tickets” — lead to substantial delays in container movement through the terminals.

About 5% of all transactions at terminals in the United States result in trouble tickets, which on average add about an hour to the “turn time,” the amount of time a truck spends at a terminal, according to a 2011 report by the National Cooperative Freight Research Program (NCFRP). The report found that “exceptions from normal processes [are] a major source of delay and cost. The long ‘tails’ on the turn time data, in particular, suggest that around 5% of the cases consume much more than the ‘normal’ time and expense.” Most trouble tickets can be prevented through better communications before a truck arrives at the terminal gates, the NCFRP report said.

PierPass has surveyed terminal operators at the Long Beach and Los Angeles ports to determine the most common causes of trouble tickets, and found that the situation at the two adjacent ports matches what NCFRP found nationally. While trouble tickets are caused by a range of issues, they usually are tied to inaccurate or incomplete information about an import container delivery or an export booking problem. When issued a trouble ticket, the driver typically has to go to a “trouble window” or office to get the issue resolved. This results in delays for customers and truckers and higher costs for terminal operators.

“Trucking companies can avoid most trouble tickets and reduce turn times by checking with the terminals’ web-based systems before coming to the terminal gates,” said Bruce Wargo, president of PierPass. “These systems let dispatchers confirm the availability of import containers or the validity of export booking numbers before prematurely sending a truck to the terminal.”

PierPass is distributing a fact sheet to trucking companies with tips on trouble-ticket prevention. PierPass today also released a video in which stakeholders representing terminal operators, trucking companies and the ports discuss approaches to reducing trouble tickets.

The NCFRP report found that better procedures by trucking companies can reduce trouble tickets. It noted that less experienced drivers and trucking companies that don’t regularly serve the ports generate exceptions and receive trouble tickets much more frequently than regular port visitors. Drivers making an average of at least one call per day had only a 3.0% trouble ticket rate, vs. 7.8% for those making less than one call per week, the report found.

At the APL Terminal in the Port of Los Angeles, the largest group of trouble tickets (34%) in July and August 2012 were issued when truckers arrived to pick up containers that were on hold. Containers can be put on hold for a variety of reasons including U.S. Customs release, agricultural inspection, and unpaid steamship charges or Traffic Mitigation Fees.

The second-largest group (20%) was due to the container number not matching the number on the Bill of Lading, which can also be checked online before delivering a container. In total, about 5% of all gate transactions – 2,500 in all – ended up at the trouble window. APL says 65% of all trouble tickets during that period could have been resolved before the truck came to the terminal.

In 2011, the Los Angeles and Long Beach ports, terminals and trucking community published the first comprehensive turn time study at the ports using GPS technology. It found that the median turn time inside the terminals during the period studied was 31 minutes per visit, and that 88% of trucks took less than 2 hours per visit. The study also found:

  • The median time trucks spent in queue waiting to get into the gates was 20 minutes and the terminal time 31 minutes, for a total visit time of 51 minutes.
  • Some have implied that it is typical to wait three hours to get into a terminal. But the study showed that only 9% of queue waits were more than an hour.
  • Only 3% of visits took three hours or more, including queue time and terminal time.

PierPass and its member terminal operators continue to offer night gate operations to address container demand and traffic mitigation. Terminals are currently offering 55 OffPeak gates across 13 terminals, in addition to 65 daytime gates, for a total of 120 gates per week for cargo pickup and delivery.

PierPass Trouble Ticket Report #3 – LBCT

This is our 3rd installment on trouble tickets and how they impact the truck driver and terminals. You can see that the most common problems are import container availability and export booking number information. This is not surprising but what is troubling is how many trucks continue to have these same issues at different terminals.

We continue to encourage truck companies to check the import availability and booking number validity in the terminal systems before sending a truck to the terminals.  eModal is another option for checking. Truck companies that spend the time and energy to check before hand, see less driver time on trouble ticket issues, it’s that simple. This information is commonly available and updated throughout the day. Why have truck drivers waste their time when in most cases, the issue can be avoided?

In this month’s example, Long Beach Container Terminal’s Jennifer Chase and Bill Madden discuss trouble tickets from their terminal’s experience and suggestions on how to avoid trouble ticket delays.

Bruce Wargo

President & CEO

PierPass, Inc.

Terminal Example: LBCTI (Long Beach Container Terminal; Pier F)

LBCT strives to provide a positive and productive experience for each and every one of our customers.

Currently, 7% of LBCT gate transactions require trouble ticket resolution. This equates to an average of 2,900 gate transactions per month.

There is an evident correlation between container availability, trouble tickets, and turn times. When a driver is dispatched to pick up a container that is unavailable, the result is a trouble ticket. Trouble tickets result in a costly and inconvenient experience for everyone involved including the driver, dispatcher, and terminal staff.

Below is a breakdown of the top ten trouble ticket reasons for September and October 2012.

Untitled